Time-series land use and land cover mapping in cloud-prone areas
Li, Z., Weng, Q., Zhou, Y., Dou, P., & Ding, X. (2024). Learning spectral-indices-fused deep models for time-series land use and land cover mapping in cloud-prone areas: The case of Pearl River Delta. Remote Sensing of Environment, 308, 114190. [HTML] [PDF]
Highlights
- Novel LULC mapping via indices-fused deep models and time series reconstruction.
- High-temporal-density 10 m seamless LULC mapping in cloudy and rainy areas (PRD).
- Overall mapping accuracy yielded up to 87.01%, outperforming existing LULC products.
- Potential to generate seamless near real-time maps and high-quality LULC data sets.
Abstract
Mapping of highly dynamic changes in land use and land cover (LULC) can be hindered by various cloudy conditions with optical satellite images. These conditions result in discontinuities in high-temporal-density LULC mapping. In this paper, we developed an integrated time series mapping method to enhance the LULC mapping accuracy and frequency in cloud-prone areas by incorporating spectral-indices-fused deep models and time series reconstruction techniques. The proposed method first reconstructed cloud-contaminated pixels through time series filtering, during which the cloud masks initialized by a deep model were refined and updated during the reconstruction process. Then, the reconstructed time series images were fed into a spectral-indices-fused deep model trained on samples collected worldwide for classification. Finally, post-classification processing, including spatio-temporal majority filtering and time series refinement considering land–water interactions, was conducted to enhance the LULC mapping accuracy and consistency. We applied the proposed method to the cloud- and rain-prone Pearl River Delta (i.e., Guangdong–Hong Kong–Macao Greater Bay Area, GBA) and used time series Sentinel-2 images as the experimental data. The proposed method enabled seamless LULC mapping at a temporal frequency of 2–5 days, and the production of 10 m resolution annual LULC products in the GBA. The assessment yielded a mean overall accuracy of 87.01% for annual mapping in the four consecutive years of 2019–2022 and outperformed existing mainstream LULC products, including ESA WorldCover (83.98%), Esri Land Cover (85.26%), and Google Dynamic World (85.06%). Our assessment also reveals significant variations in LULC mapping accuracies with different cloud masks, thus underscoring their critical role in time series LULC mapping. The proposed method has the potential to generate seamless and near real-time maps for other regions in the world by using deep models trained on datasets collected globally. This method can provide high-quality LULC data sets at different time intervals for various land and water dynamics in cloud- and rain-prone regions. Notwithstanding the difficulties of obtaining high-quality LULC maps in cloud-prone areas, this paper provides a novel approach for the mapping of LULC dynamics and the provision of reliable annual LULC products.
1. Introduction
Land use and land cover (LULC) datasets play a vital role as fundamental data in various applications, including land use planning and management, eco-environment conservation, and agriculture. LULC mapping has consistently been a popular research topic, and it continues to evolve alongside the advancements in data acquisition and processing capacities. Over the past few decades, the spatial resolution of LULC mapping has been continuously improved from medium to high resolution at the meter- and even submeter-levels. Meanwhile, the temporal frequency of LULC mapping is also promoted from annual mapping to near real-time mapping. Recent machine learning techniques, especially deep learning, have significantly revolutionized LULC mapping, and are widely used for producing new regional and global LULC products. The advancements of LULC mapping in the above-mentioned aspects have marked a significant milestone in achieving accurate and continuous LULC mapping with dense image time series. Despite the remarkable progress made in recent years, two major issues in the field of LULC mapping persist. On one hand, the cloud coverage in optical image time series reduces the availability of data for time series LULC mapping. Meanwhile, the importance of accurate cloud masks cannot be overstated for precise high-temporal-density near real-time LULC mapping, especially in cloud-prone areas. However, the cloud masks that are commonly used are often not highly accurate, as evidenced by multiple recent studies, leaving space for further improvements. Specifically, for Sentinel-2 imagery, the Sentinel-2 Level 1-C cloud mask product has been found to generally underestimate cloud presence, which cannot be ignored. Other existing cloud detection methods, such as Sen2Cor, MAJA, and Fmask, exhibit varying limitations in accurately distinguishing clouds from bright ground surfaces and in effectively identifying thin cirrus clouds and cloud shadows, as summarized in the recent study. These limitations highlight the necessity for more sophisticated methods, such as the deep learning model, which offers improved accuracy through the use of multiscale features but is limited by the requirement for extensive training data. Despite the progress made, the accuracy of cloud masks remains suboptimal, underscoring the necessity for ongoing efforts to refine cloud detection techniques to enhance LULC mapping capabilities. Additionally, revealing the quantitative effects of clouds and different cloud masks on the accuracy of LULC mapping is another aspect that warrants further exploration. On the other hand, the identification of dynamically changing land patterns, especially over varying water areas, such as paddy fields, is challenging but important for the composition of accurate annual LULC maps. Meanwhile, the annual LULC mapping, which leverages all available image time series within a year, is expected to further promote the mapping accuracy. To improve high-temporal-density LULC mapping in cloudy and rainy areas, we proposed an integrated time series LULC mapping method to enhance the LULC mapping under dense cloud coverage and varying water conditions. This method aims to generate and composite seamless near real-time, monthly, seasonal, and annual LULC maps with high accuracy. Specifically, spectral-indices-fused deep models that fuse task-specific spectral indices from images are constructed for cloud masking and LULC classification, respectively. The refined cloud masks through time series refinement are expected to reduce the negative influences of clouds on LULC mapping. Meanwhile, the reconstruction of time series cloudy images will benefit LULC mapping in terms of accuracy. In particular, the consideration of temporal change patterns in post-classification processing benefits the identification of classes, such as crops, which may frequently occur in water–land interactions. The objectives of this study are as follows: 1) develop an integrated method for high-quality time series LULC mapping in rainy and cloudy areas; 2) reveal the effects of clouds on LULC mapping and the benefits of time series reconstruction and LULC mapping with dense image time series; and 3) produce a series of LULC products over the study area that outperform the other existing products. The proposed method is expected to be applied in other regions in the world to generate highly reliable LULC products, especially in cloud-prone areas.
2. Study area and data
The Guangdong–Hong Kong–Macao Greater Bay Area (GBA thereafter) (Fig. 1), one of the most developed regions in China, encompasses a total of 11 major cities and spans in the Pearl River Delta region, which has experienced rapid land use and land cover changes in the recent decades. The rainy and cloudy weather conditions in the GBA present a challenge for high-temporal-density LULC mapping, especially during annual rainy seasons when the region experiences dense cloud coverage. The existence of the Pearl River and coastal environment results in frequent land and water interactions in the GBA, leading to highly dynamic changes in LULC types in the region. Thus, GBA is selected as the study area to examine the effectiveness of the proposed method for LULC mapping in cloud-prone areas.
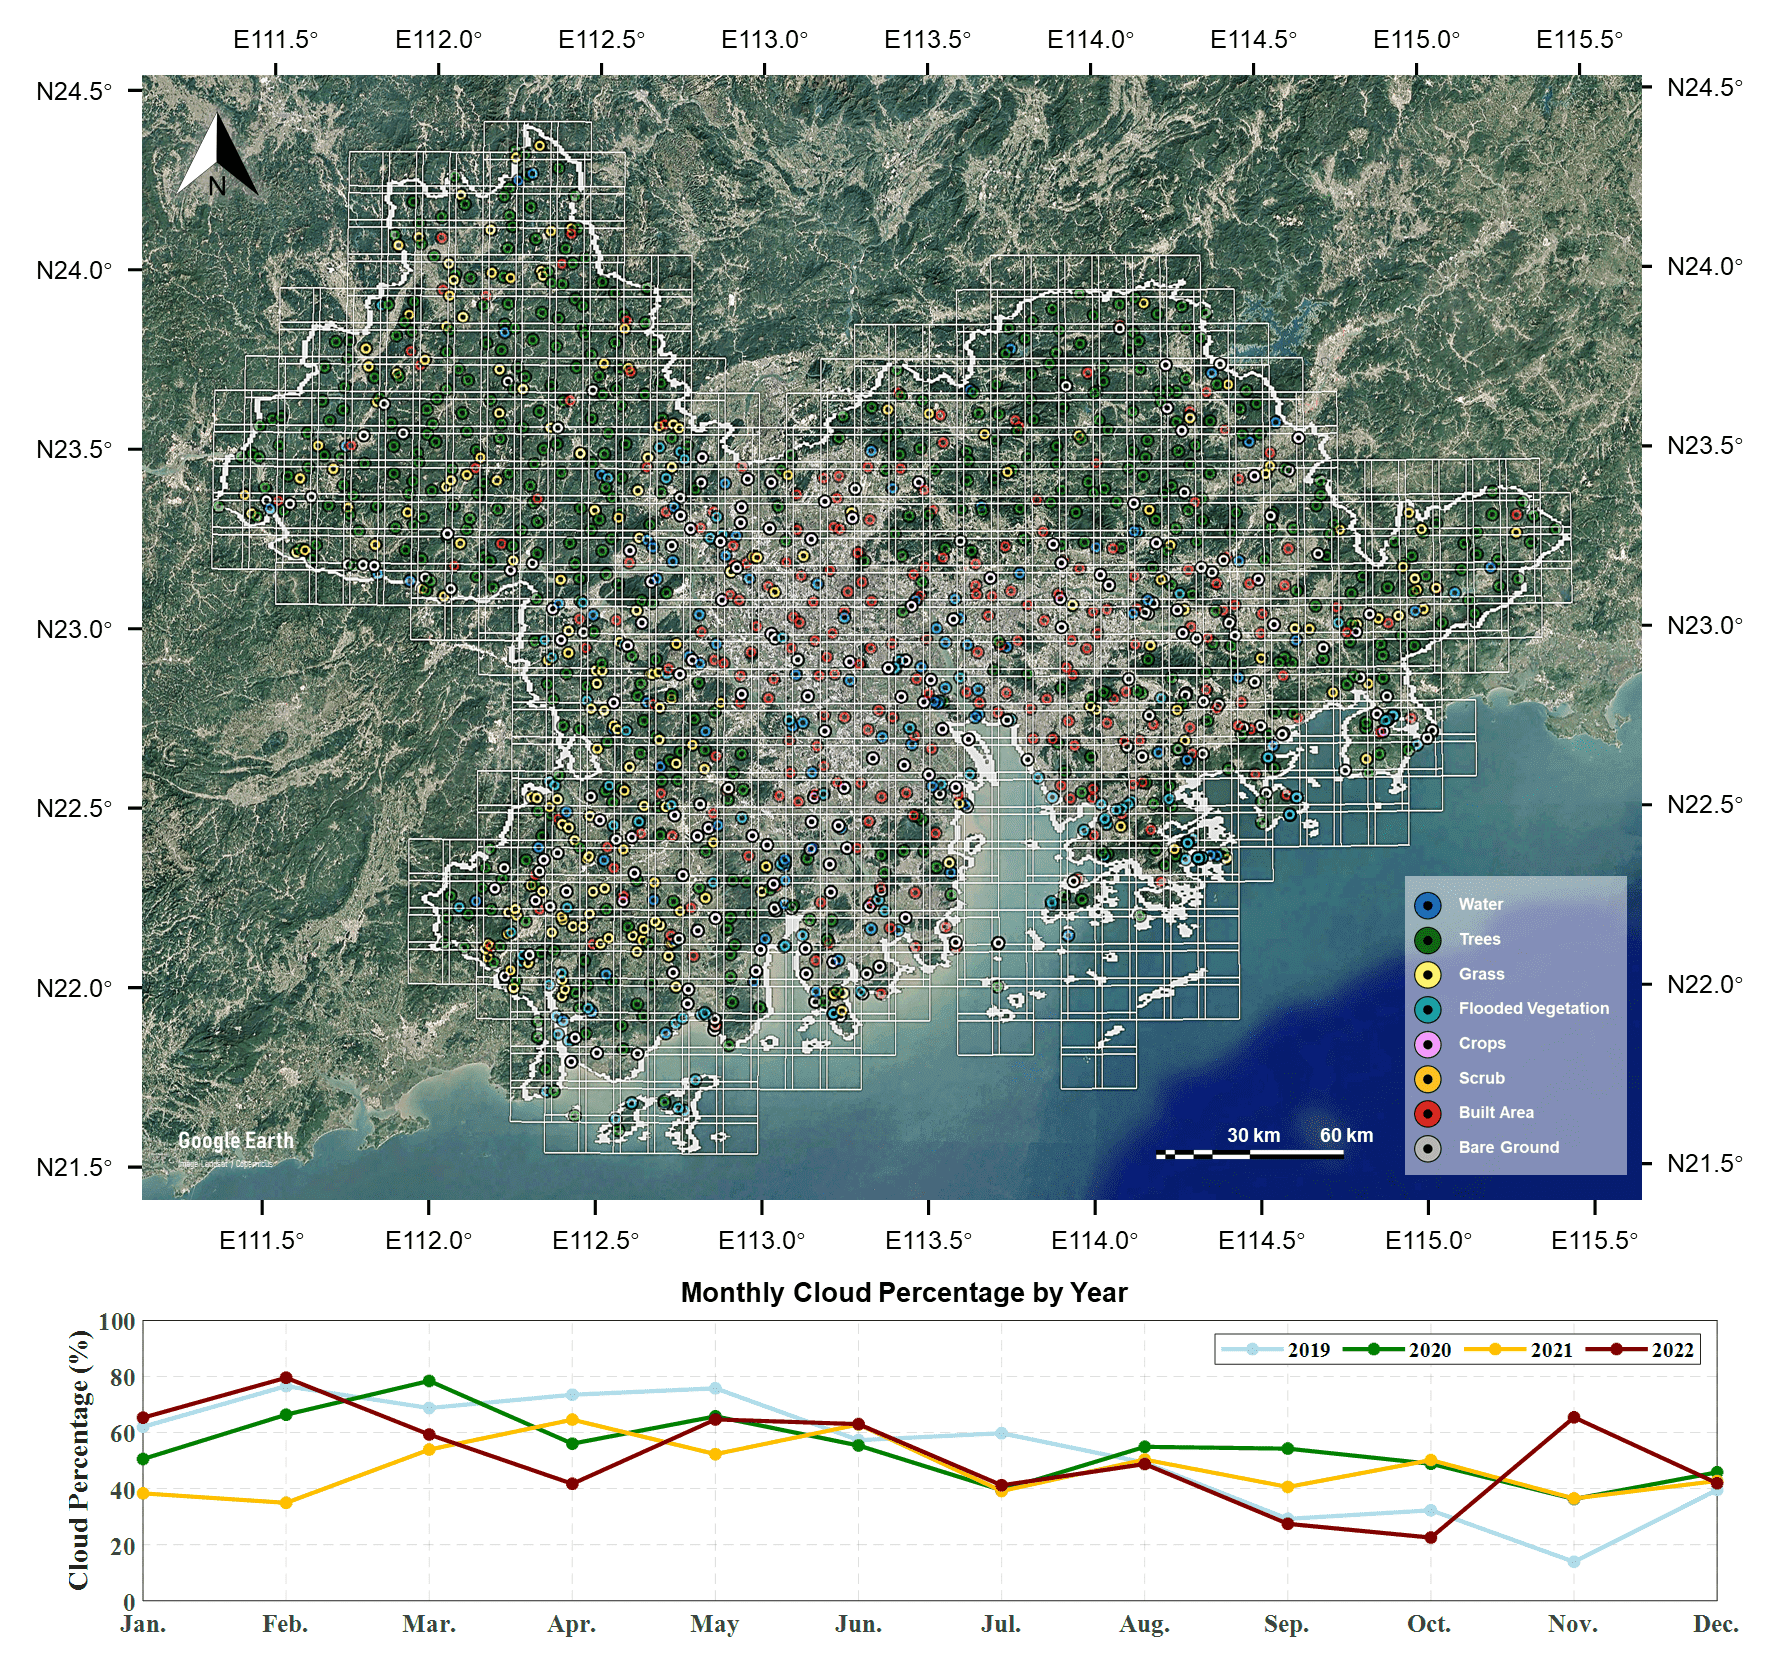
Fig. 1. Study area Pearl River Delta and monthly cloud percentage in Sentinel-2 imagery utilized for the study. The upper image shows the location of the study area and the distribution of validation sample sites. The lower image represents the average monthly percentages of cloud coverage in Sentinel-2 imagery in the study area during 2019–2022.
The harmonized Sentinel-2 Level-2A (i.e., surface reflectance) image time series in the GBA is exported through the Google Earth Engine (GEE) platform. In addition, the LULC mapping experiments incorporated an image dataset spanning 4 years from December 1, 2018, to January 31, 2023. Majority of the areas in the GBA are revisited by Sentinel-2A/B satellites every 5 days, resulting in a total of 299 typical coverages during the study period. The Sentinel-2 time series over GBA among the 4 years are densely covered by clouds with an estimated mean cloud percentage as high as 51.61%. The monthly mean cloud percentages for each year are provided in Fig. 1, which depicts that high-quality and high-temporal-density LULC mapping in GBA is challenging due to the cloud coverage. To efficiently proceed with dense time series image data, as shown in Fig. 1, the Sentinel-2 time series in the GBA is divided into 40×30 image tiles for tile-by-tile data acquisition and processing. Only the 695 tiles that cover the GBA are involved for experiments. In addition, we collected sample points based on very high-resolution satellite images in Google Earth through manual interpretation to comprehensively evaluate the time series LULC products. In Fig. 1, the 1263 sample sites over GBA are selected by stratified random sampling. The selected sample points cover multiple dates between December 2018 and January 2023, with consideration for the LULC-changed areas. Accordingly, multiple labels are associated with different dates for sample points where LULC changes occurred during the above-mentioned period. Meanwhile, only a single label is associated without a specific date for sample points that belong to the same LULC category over the entire study period, if all manually interpreted labels are in the same category based on all available historical observations on Google Earth during the study period. Such a collection of sample points, including the LULC-changed and unchanged areas over time, will guarantee a more comprehensive evaluation of time series LULC products.
3. Methodology
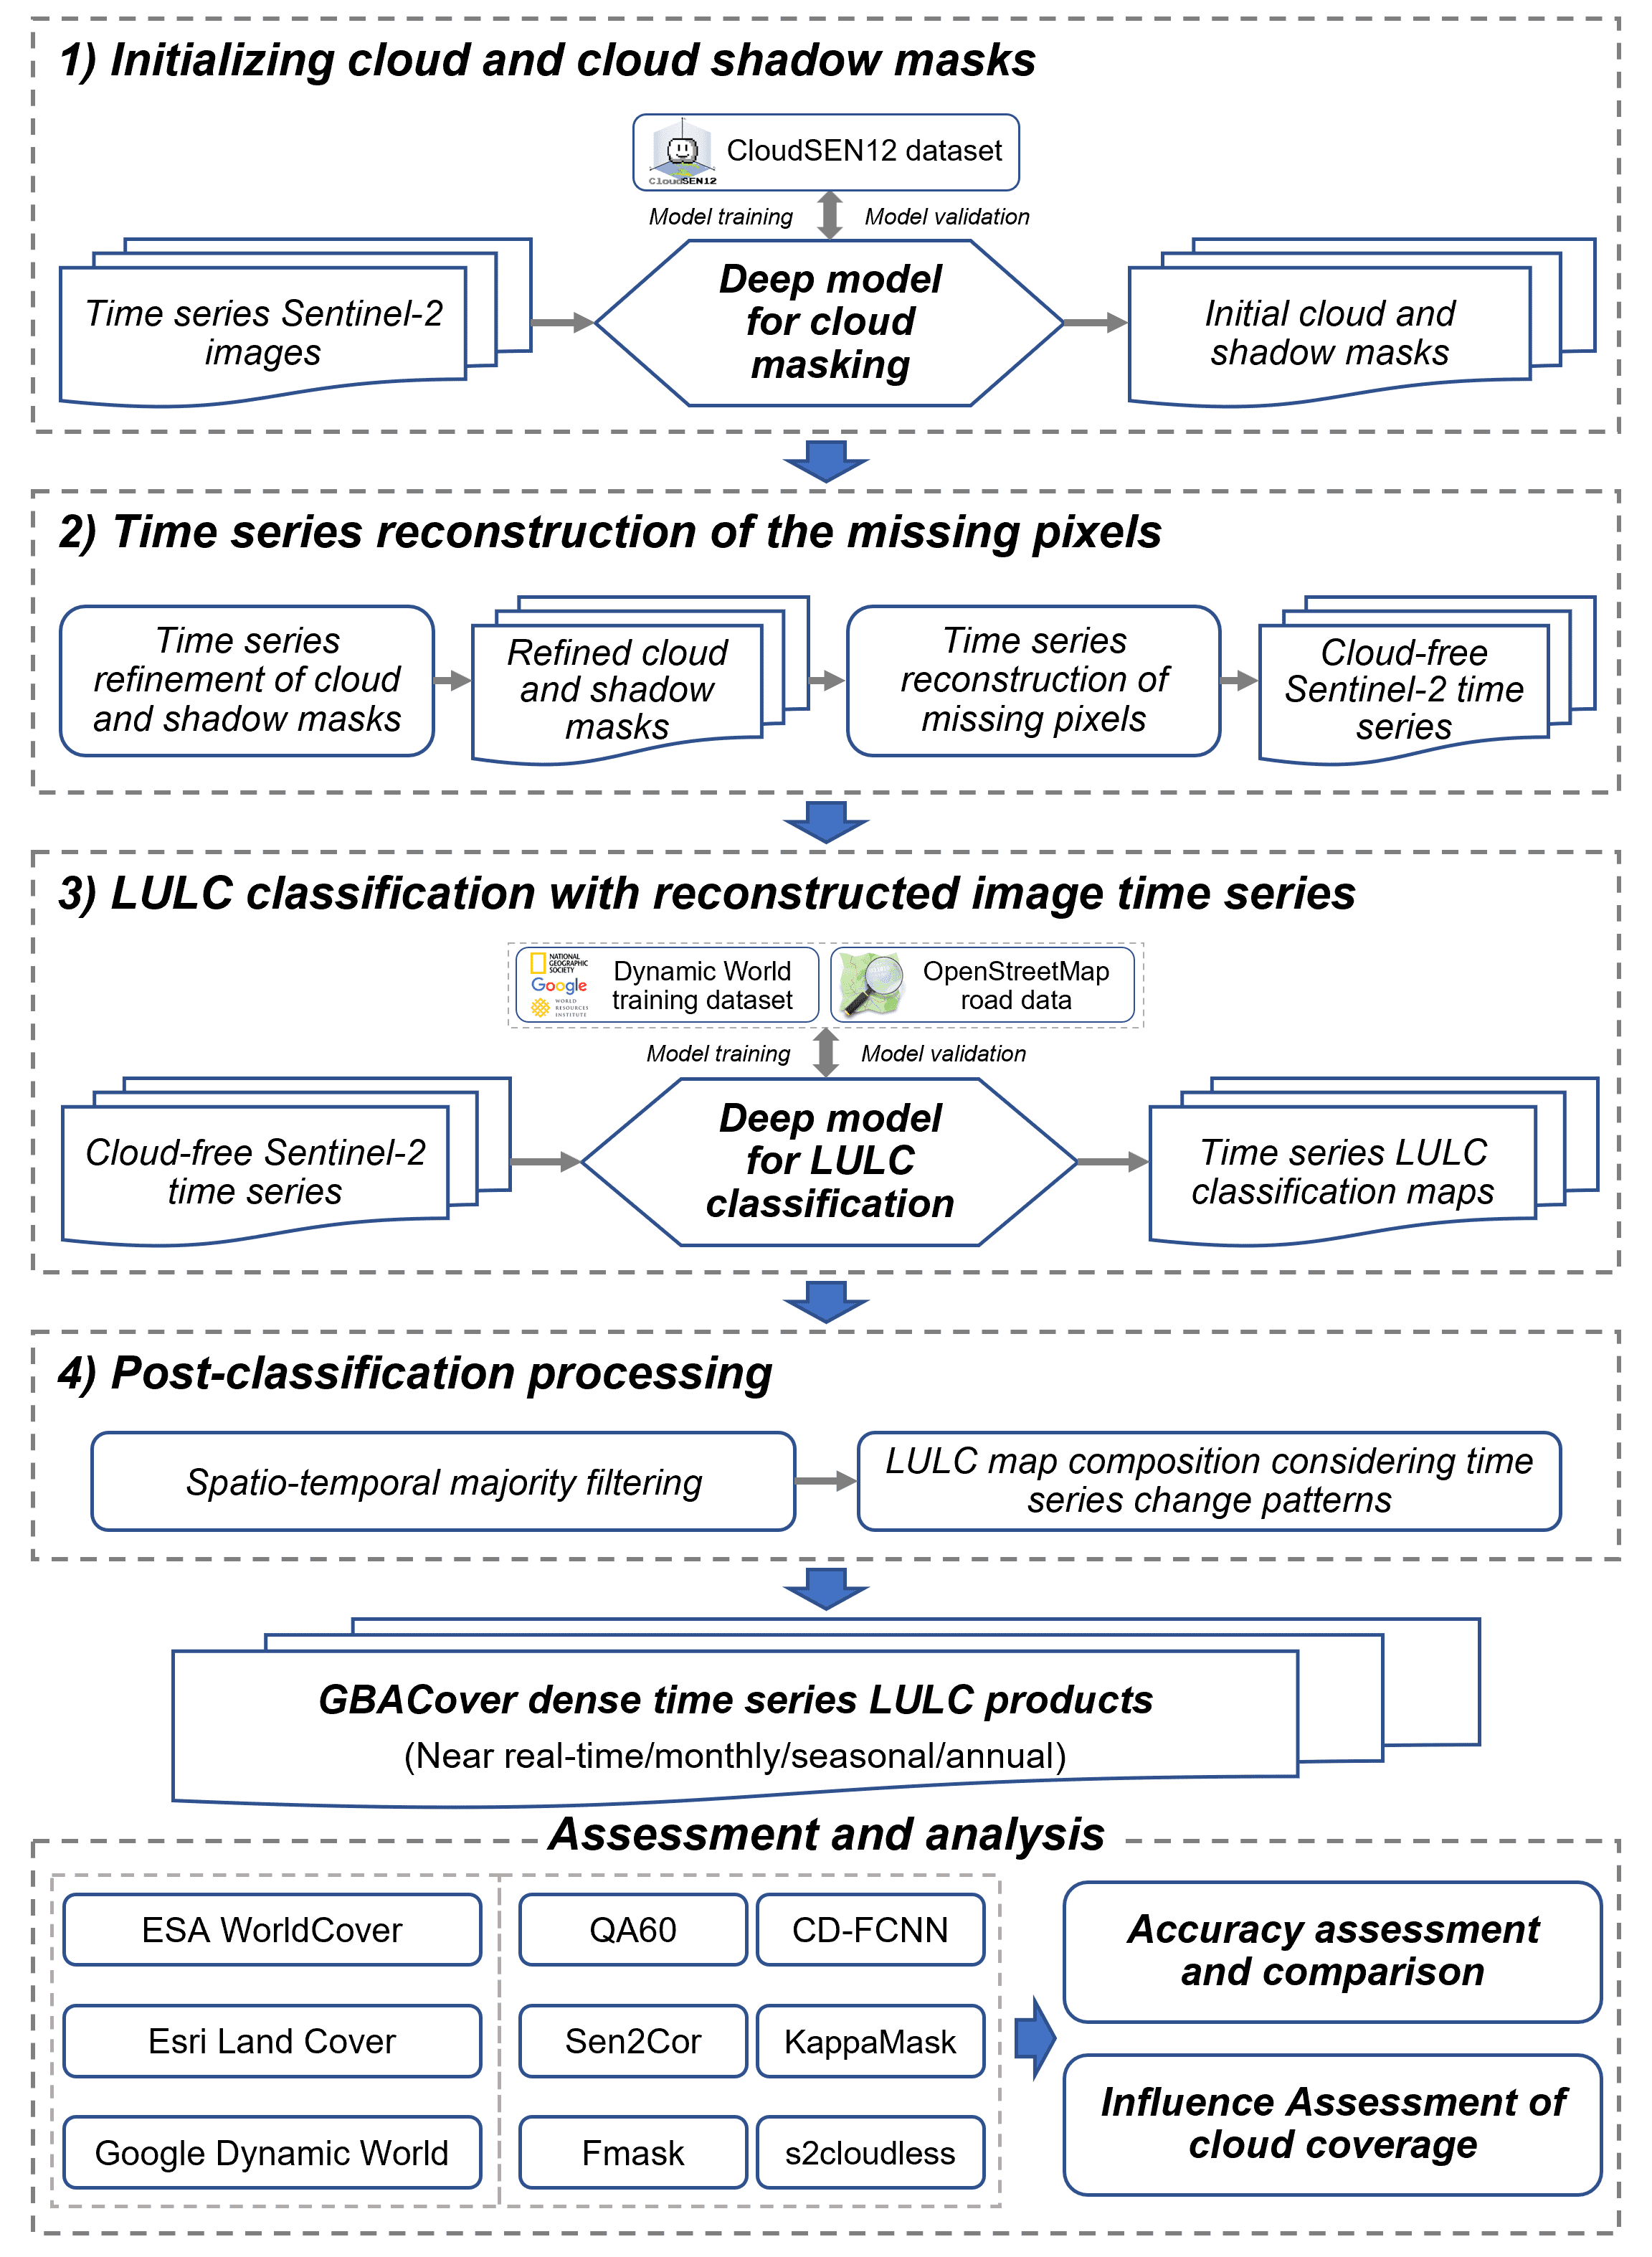
We proposed an integrated LULC mapping method, which comprises four main steps (Fig. 2). The proposed method first initializes cloud and cloud shadow masks for time series Sentinel-2 images by the spectral-indices-fused deep model based on CNN. The cloud- or cloud shadow-contaminated pixels in the Sentinel-2 time series are then reconstructed through time series filtering, during which the initial cloud masks are refined to improve the reconstruction effects. Thereafter, the reconstructed time series images are fed into another deep model trained on samples collected worldwide for LULC classification. Finally, post-classification processing is conducted to enhance the LULC mapping accuracy and consistency. The accuracy of the produced LULC products is quantitatively evaluated and compared with existing mainstream LULC products in the GBA. In particular, the effects of the cloud coverage on LULC mapping are evaluated.
4. Results and analysis
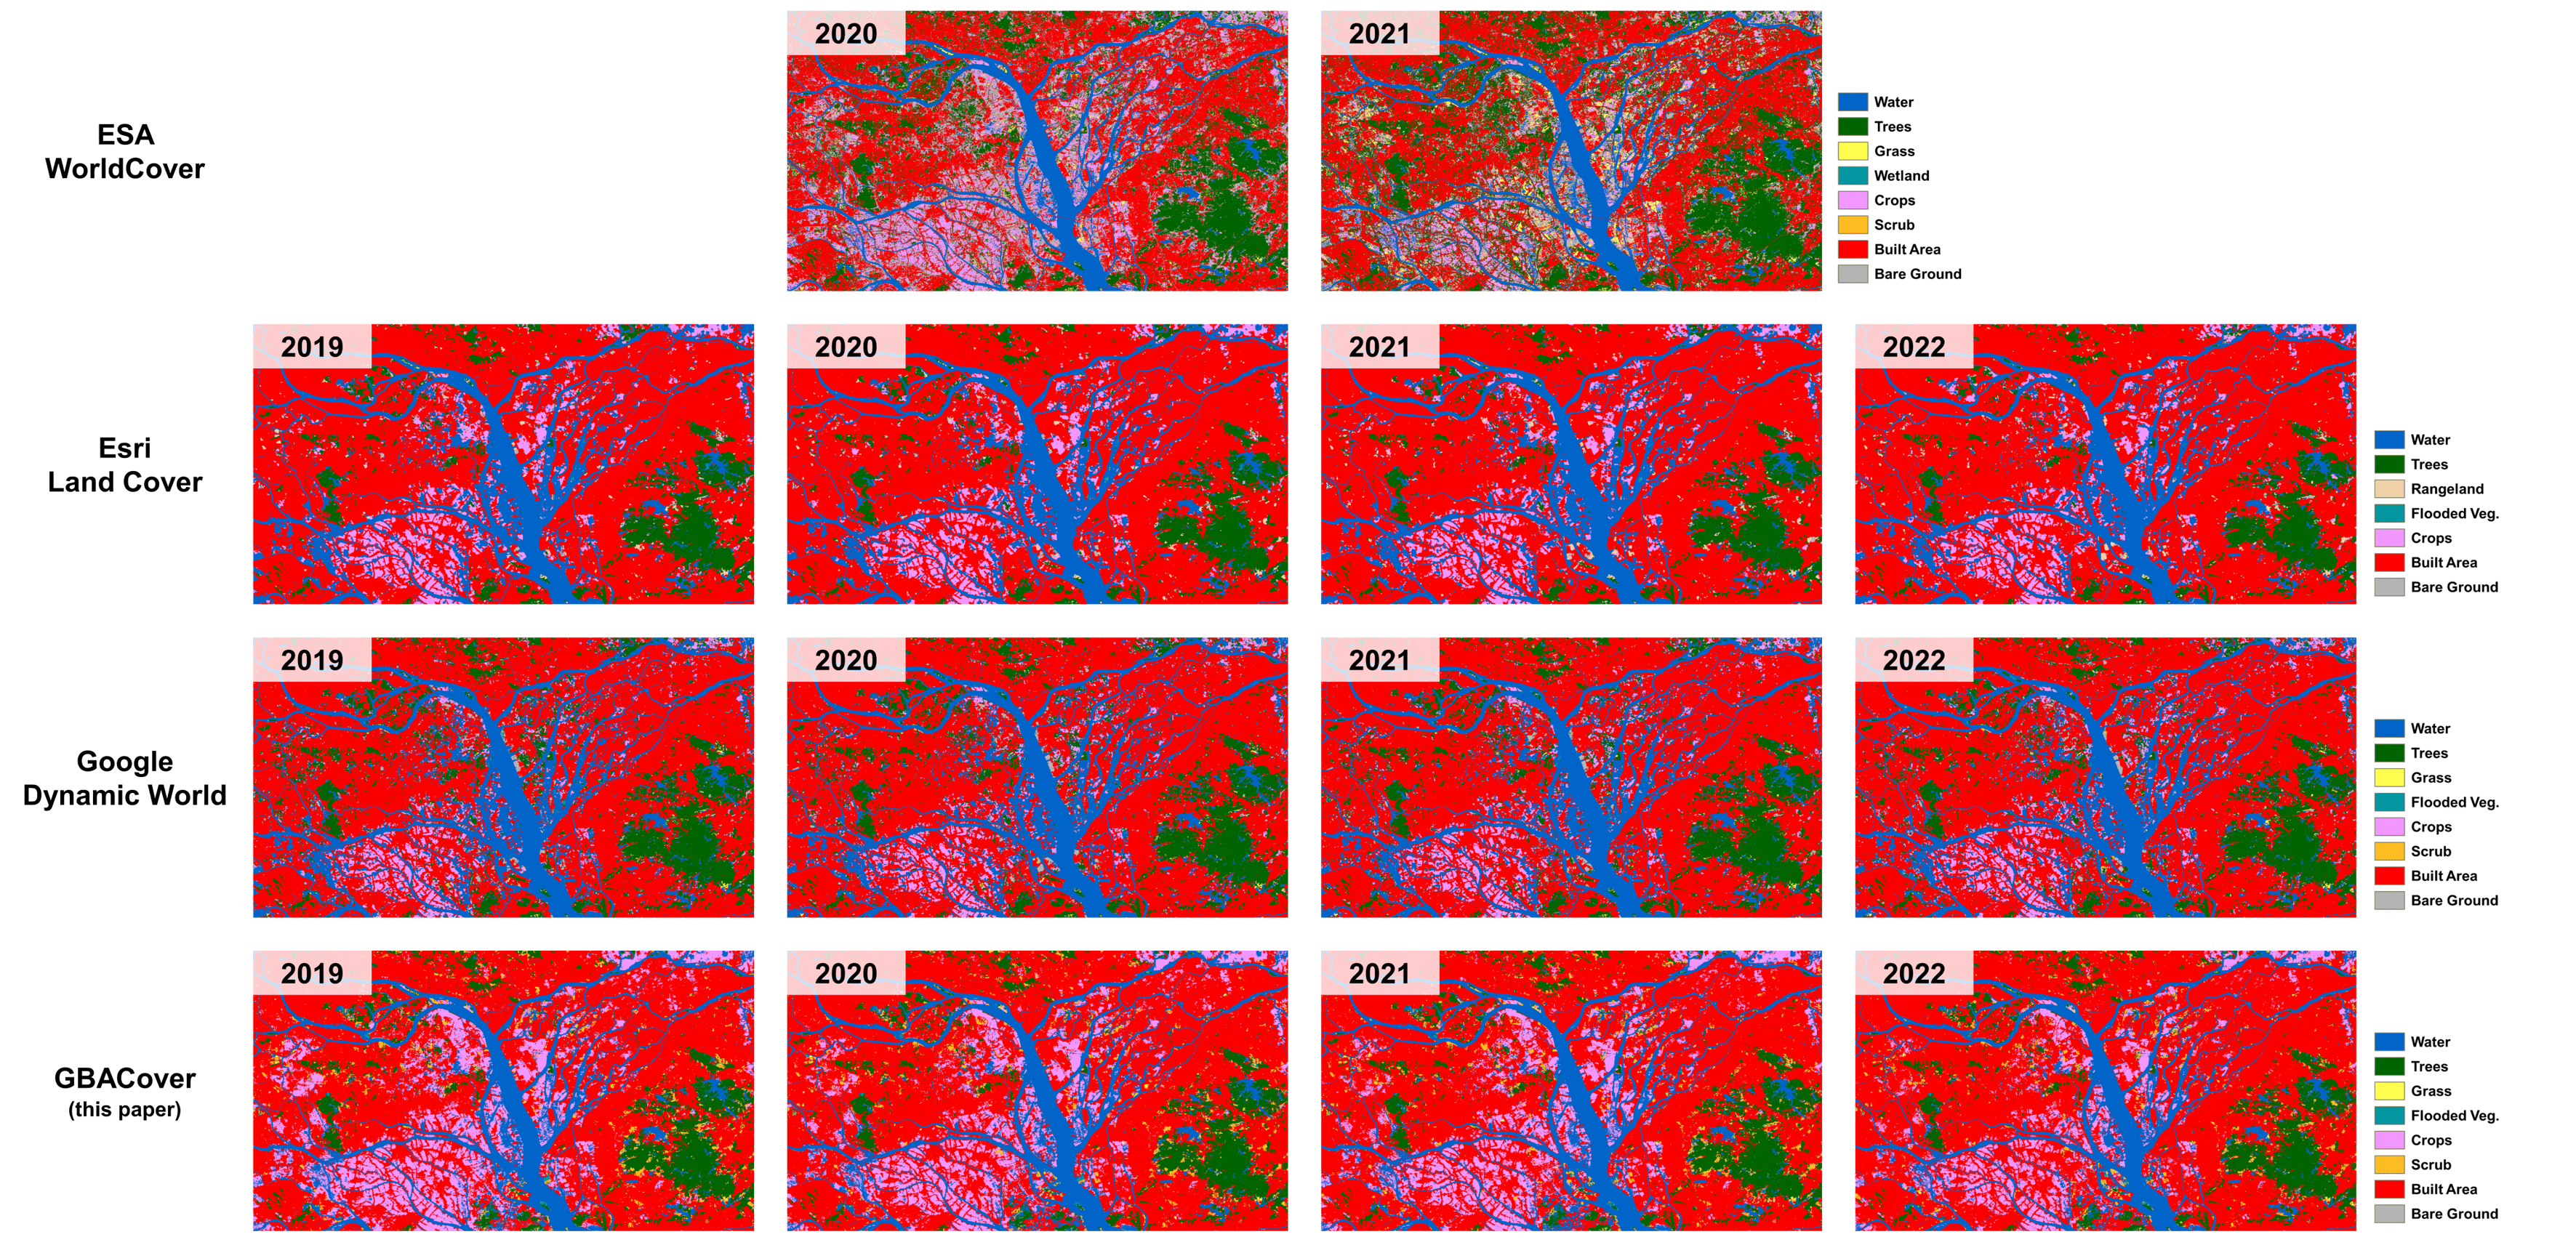
The 4-year Sentinel-2 time series covering GBA was used as the experiment data, in which a total of 695 tiles of image time series exist. All image time series tiles are processed tile by tile according to the processes shown in Fig. 1 by using the pretrained cloud masking model and LULC classification model. The spectral-indices-fused deep learning models were separately validated for both cloud and cloud shadow detection and LULC classification tasks, and they achieved the best performance among the compared methods. The monthly, seasonal, and annual LULC maps for the entire GBA can be finally produced by composting and mosaicking time-series LULC map tiles. We named the generated LULC products in GBA as GBACover, which include a series of dense time series LULC maps at multiple temporal densities (i.e., near real-time, monthly, seasonal, and annual scales). The accuracy of the generated GBACover products can be quantitatively evaluated and compared with other global LULC products over the GBA, including ESA WorldCover, Esri Land Cover, and Google Dynamic World by using the manually interpreted LULC samples in GBA. All three existing LULC products were produced based on machine learning methods, making them highly accurate and comparable with LULC maps generated with the proposed method.
Considering the differences among the four compared products, the coloring scheme for mapping is unified to the same scheme as ESA WorldCover products. The naming of LULC types is also unified as defined in the Dynamic World training dataset. Table 3 shows the accuracy of our annual GBACover products and the other compared LULC products over the GBA from 2019 to 2022. The validation results suggested that GBACover has the highest overall accuracy for the annual LULC mapping in GBA over the four consecutive years of 2019–2022. Meanwhile, Google Dynamic World and Esri Land Cover are the second best for their better performances in separate years. The assessment shows a mean overall accuracy of 87.01% of GBACover for annual mapping in 2019–2022 over GBA and outperforms ESA WorldCover of 83.98% in 2020 and 2021, Esri Land Cover of 85.26%, and Google Dynamic World of 85.06%. If the accuracy assessment for wetlands in ESA WorldCover are excluded due to the absence of validation labels, the mean overall accuracy of ESA WorldCover 2020 and 2021 is 85.82%, which is higher than its actual accuracy because of challenges in the accurate identification of wetlands. It is worth noting that there is temporal variance in the classification accuracy of composited LULC maps across different lengths of periods. Despite the GBACover achieving a mean overall accuracy of 87.01% at an annual scale, the validation of the time series LULC maps generated by the proposed method reports a mean overall accuracy of 80.13% at a near real-time scale. The annual LULC maps over the Pearl River estuary region in the consecutive 4 years from 2019 to 2022 are shown in Fig. 3, which confirms the superiority of GBACover compared with other LUCL products, especially over varying water areas, such as paddy fields.
This study also evaluated the impact of using different cloud masks on the accuracy of the generated time series LULC classification results. The masks from QA60, Sen2Cor, s2cloudless, and masks generated by the proposed SIFDM model before and after time series refinement are involved in the comparisons to quantitatively evaluate the influence of the accuracy of cloud and cloud shadow masks on LULC mapping. Specifically, the time series LULC maps, generated based on the original Sentinel-2 time series without reconstruction, are validated with the manually labeled samples in GBA. The cloud/cloud shadow contaminated pixels, identified by the compared masks, are excluded from the generated time series LULC maps before validation. This process allows for the evaluation of LULC mapping performances with different masks. Specifically, the utilization of the refined and initial cloud masks generated by SIFDM, which perform best in cloud and cloud shadow masking compared with other compared masks, results in the best overall accuracies of 81.16% and 68.06% for the time series LULC mapping, respectively. The refined masks can even contribute to a higher overall LULC classification accuracy than the original masks generated by SIFDM, confirming the benefits of time series refinement for improving the accuracy of cloud masks. More accurate cloud masks contribute to the higher accuracy of LULC mapping. The two collections of masks generated by s2cloudless result in the overall LULC classification accuracy of 59.35% and 57.04% with two different binarization thresholds of 25 and 50 for the grayscale mask segmentation, respectively. The overall accuracy of the LULC classification with Sen2Cor masks is 64.21%, which is higher than that of s2cloudless, potentially due to the additional cloud shadow information labeled in Sen2Cor masks. The less accurate cloud masks from QA60 result in an overall LULC classification accuracy of 47.99%, which is worth the users’ attention for the application of QA60 masks for Sentinel-2 image interpretation. However, it is noteworthy that the accuracy of cloud masks is rarely considered in studies relevant to satellite image interpretation based on deep learning. This oversight raises concerns regarding the accurate mapping of land and water dynamics with optical satellite images, especially in cloudy conditions. This paper not only provides a comprehensive methodology for LULC mapping in cloud-prone areas by incorporating advanced cloud masking and LULC classification models but also assesses the influences of cloud masks on LULC mapping. The assessment reveals that LULC mapping accuracies vary significantly, from 47.99% to 81.16%, when applying different cloud masks, thus underscoring the importance of accurate cloud masks for time series LULC mapping.
5. Discussion
5.1 Benefits of time series reconstruction for LULC mapping
This study applied Whittaker filtering for the time series reconstruction of the contaminated pixels in the image time series, which is expected to benefit dealing with LULC mapping in cloud-prone areas. In Fig. 4, taking LULC mapping in agriculture land as an example, an agriculture land can either be covered by water or planted with crops, and the land cover change between water and crops may occur several times within a year. In this case, the mapping results vary with the involved images for LULC mapping, resulting in biases for mapping of LULC types that involve land and water interactions (e.g., crops and wetland). The accurate mapping of the LULC types that involve land and water interactions becomes more challenging because the cloud coverage on the image time series randomly occurs. Reconstruction of the cloud- or cloud shadow-contaminated areas in the image time series is necessary for the accurate LULC mapping to minimize the biases and errors in time series mapping caused by the random cloud coverage and selected images. Composting high-quality annual, seasonal, and even monthly LUCL maps is possible because of the reconstructed cloud-free image time series. The time series change patterns can be considered to refine the mapping results.
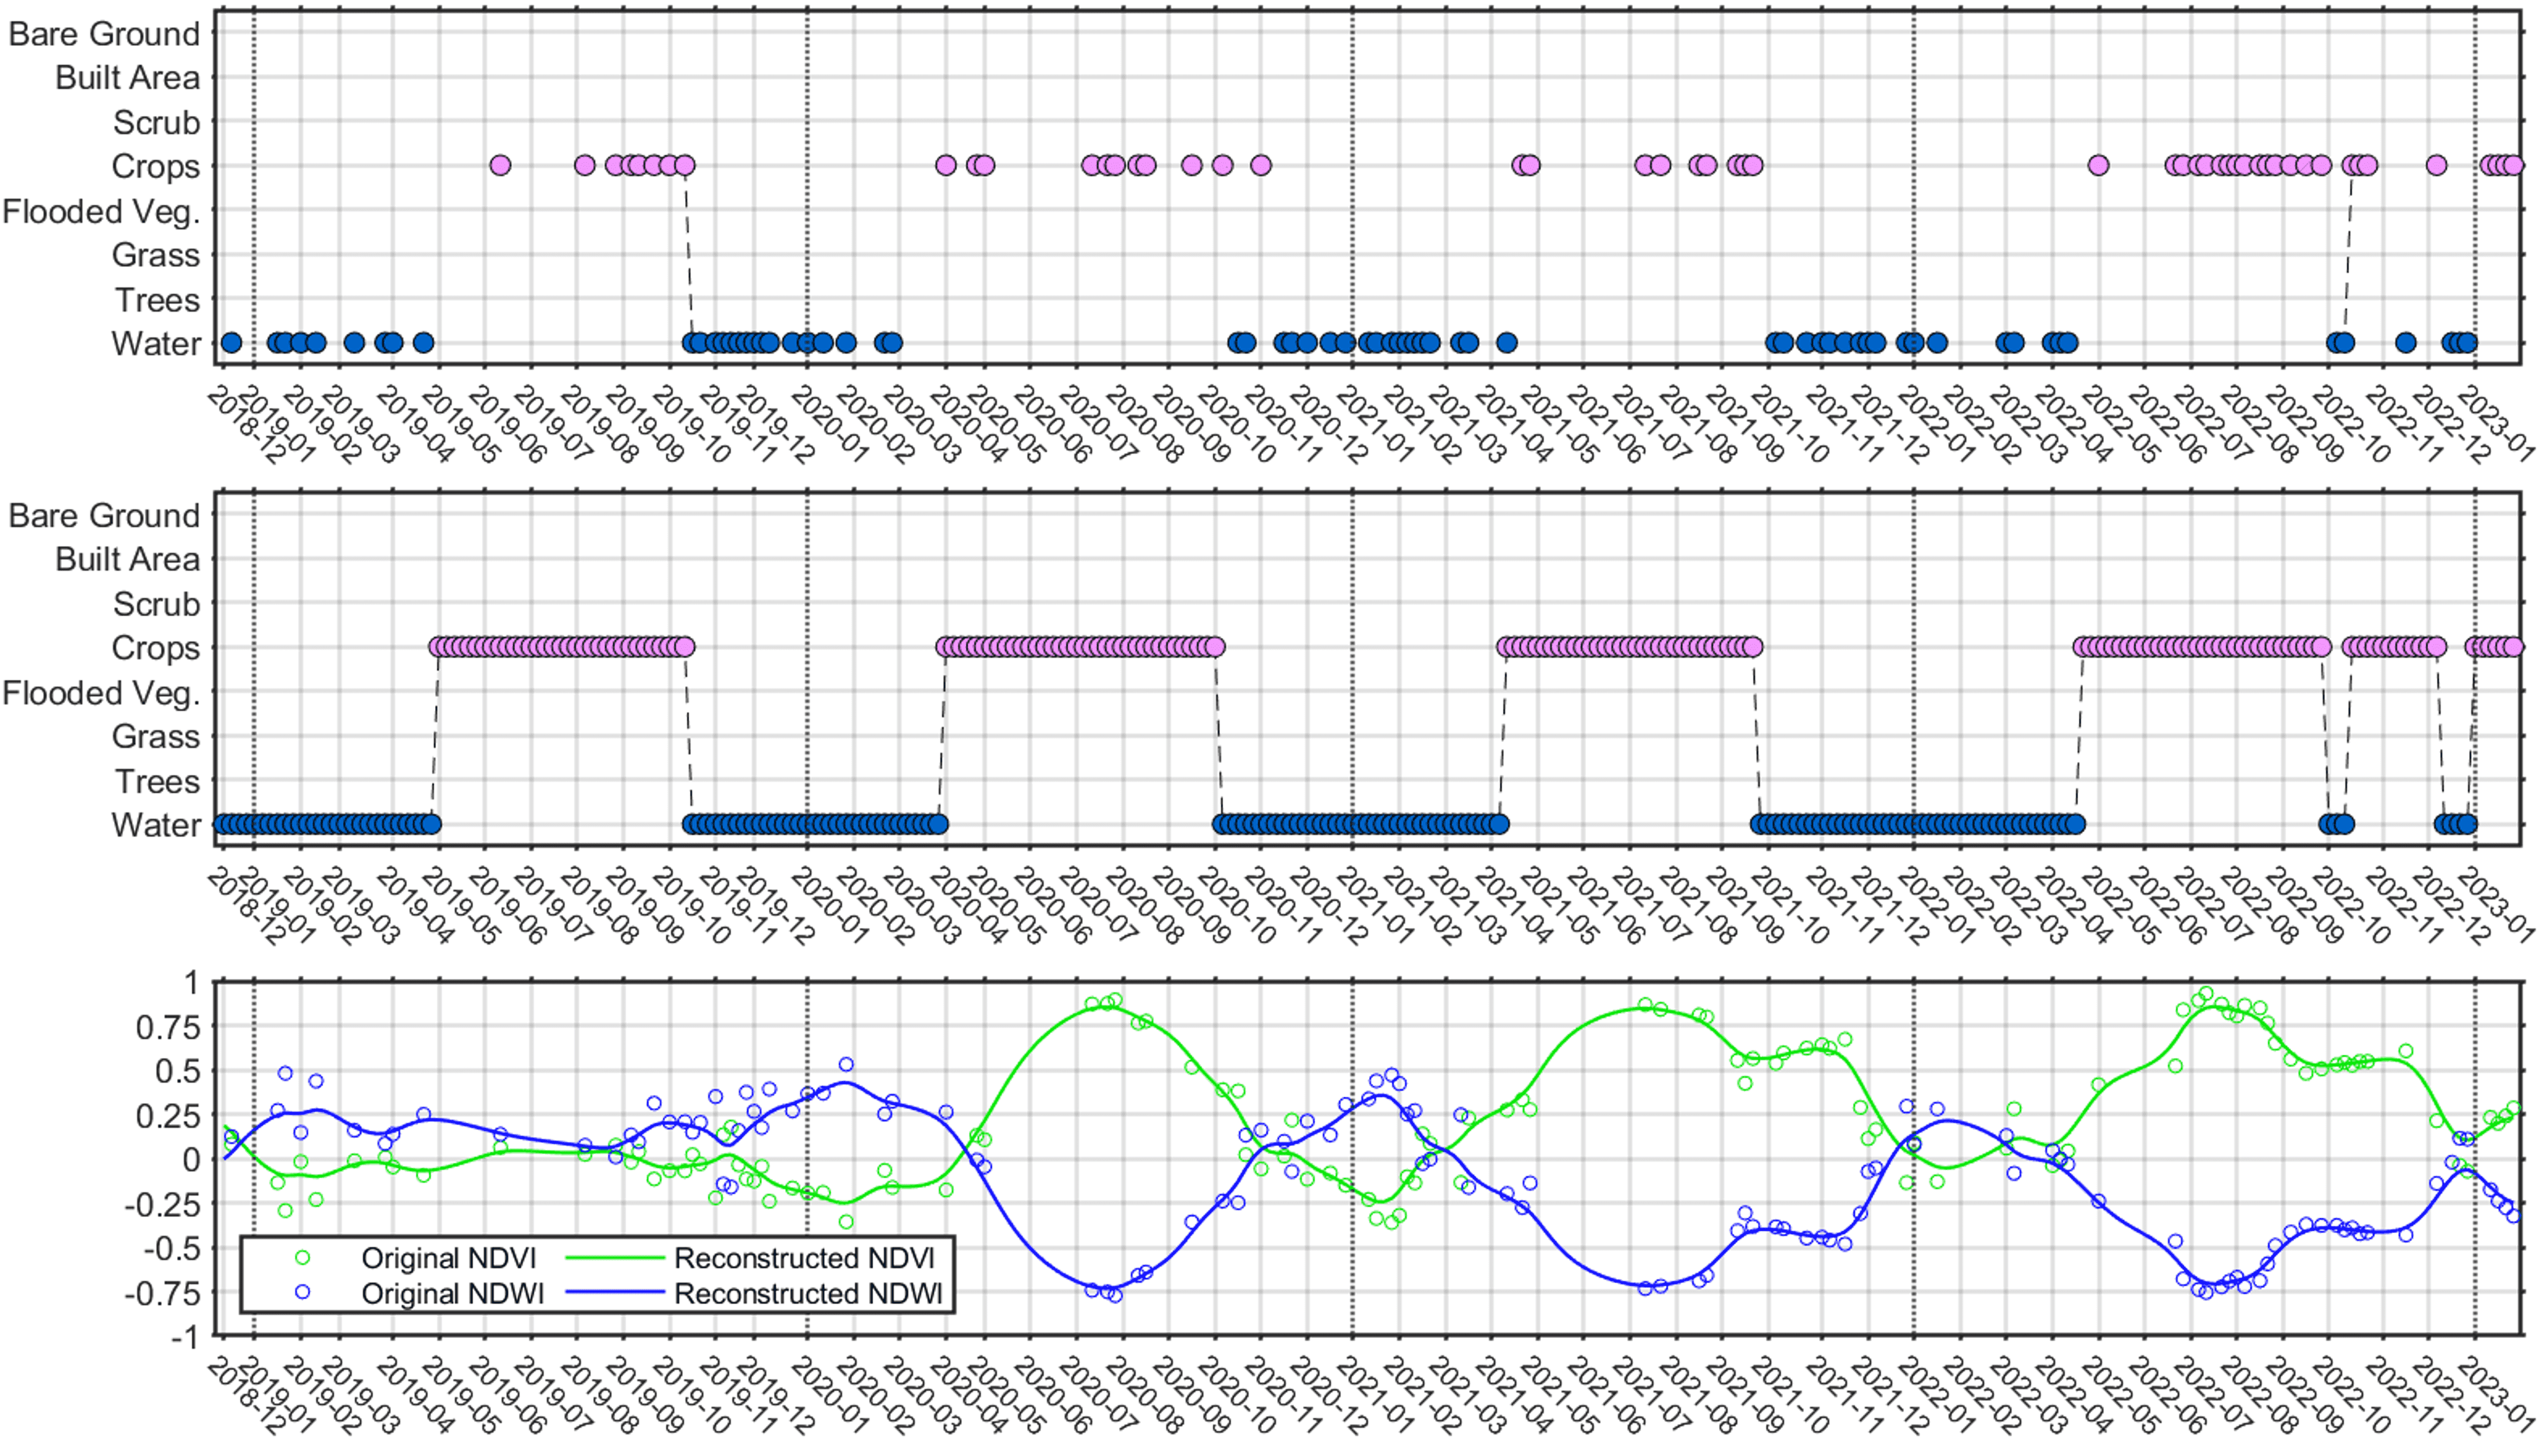
Fig. 4. Comparisons of time series mapping with the original and the reconstructed cloud-free images. The upper figure denotes the results generated with the original images, in which the missing points in the time series are caused by cloud coverage. The middle figure refers to the time series mapping results with the reconstructed images and after post-classification processing. The lower figure provides the NDVI and NDWI time series derived from both the original and the reconstructed cloud-free images, respectively.
5.2 Annual LULC mapping with dense image time series
Existing annual LULC products are typically produced based on images acquired during the vegetation growing season. However, optical satellite imagery suffers from dense cloud coverage during these rainy and cloudy seasons, resulting in limited available cloud-free images for the annual LULC mapping. Accordingly, the annual mapping results are generated only based on one or several valid satellite observations. In this study, the annual LULC maps are generated and composited based on all available Sentinel-2 images for a year. Post-classification processing for the time series LULC maps is additionally conducted to improve the time series consistency and filter out noises. Consequently, the accuracy and robustness of the annual LULC mapping can be improved and enhanced. LULC mapping with dense image time series holds promise in capturing the periodic LULC change patterns (e.g., the land and water interactions in crop areas), which can be identified through the time series post-classification processing and analysis. In Fig. 5, the frequencies of the LULC types can be acquired from dense time series LULC maps, from which the annual LULC change trends can be quantitatively measured with high accuracy and in an intuitive manner (e.g., the change trends from crops to built area over the 4 years). Therefore, dense time series post-classification processing and analysis benefit LULC mapping in terms of accuracy and robustness.
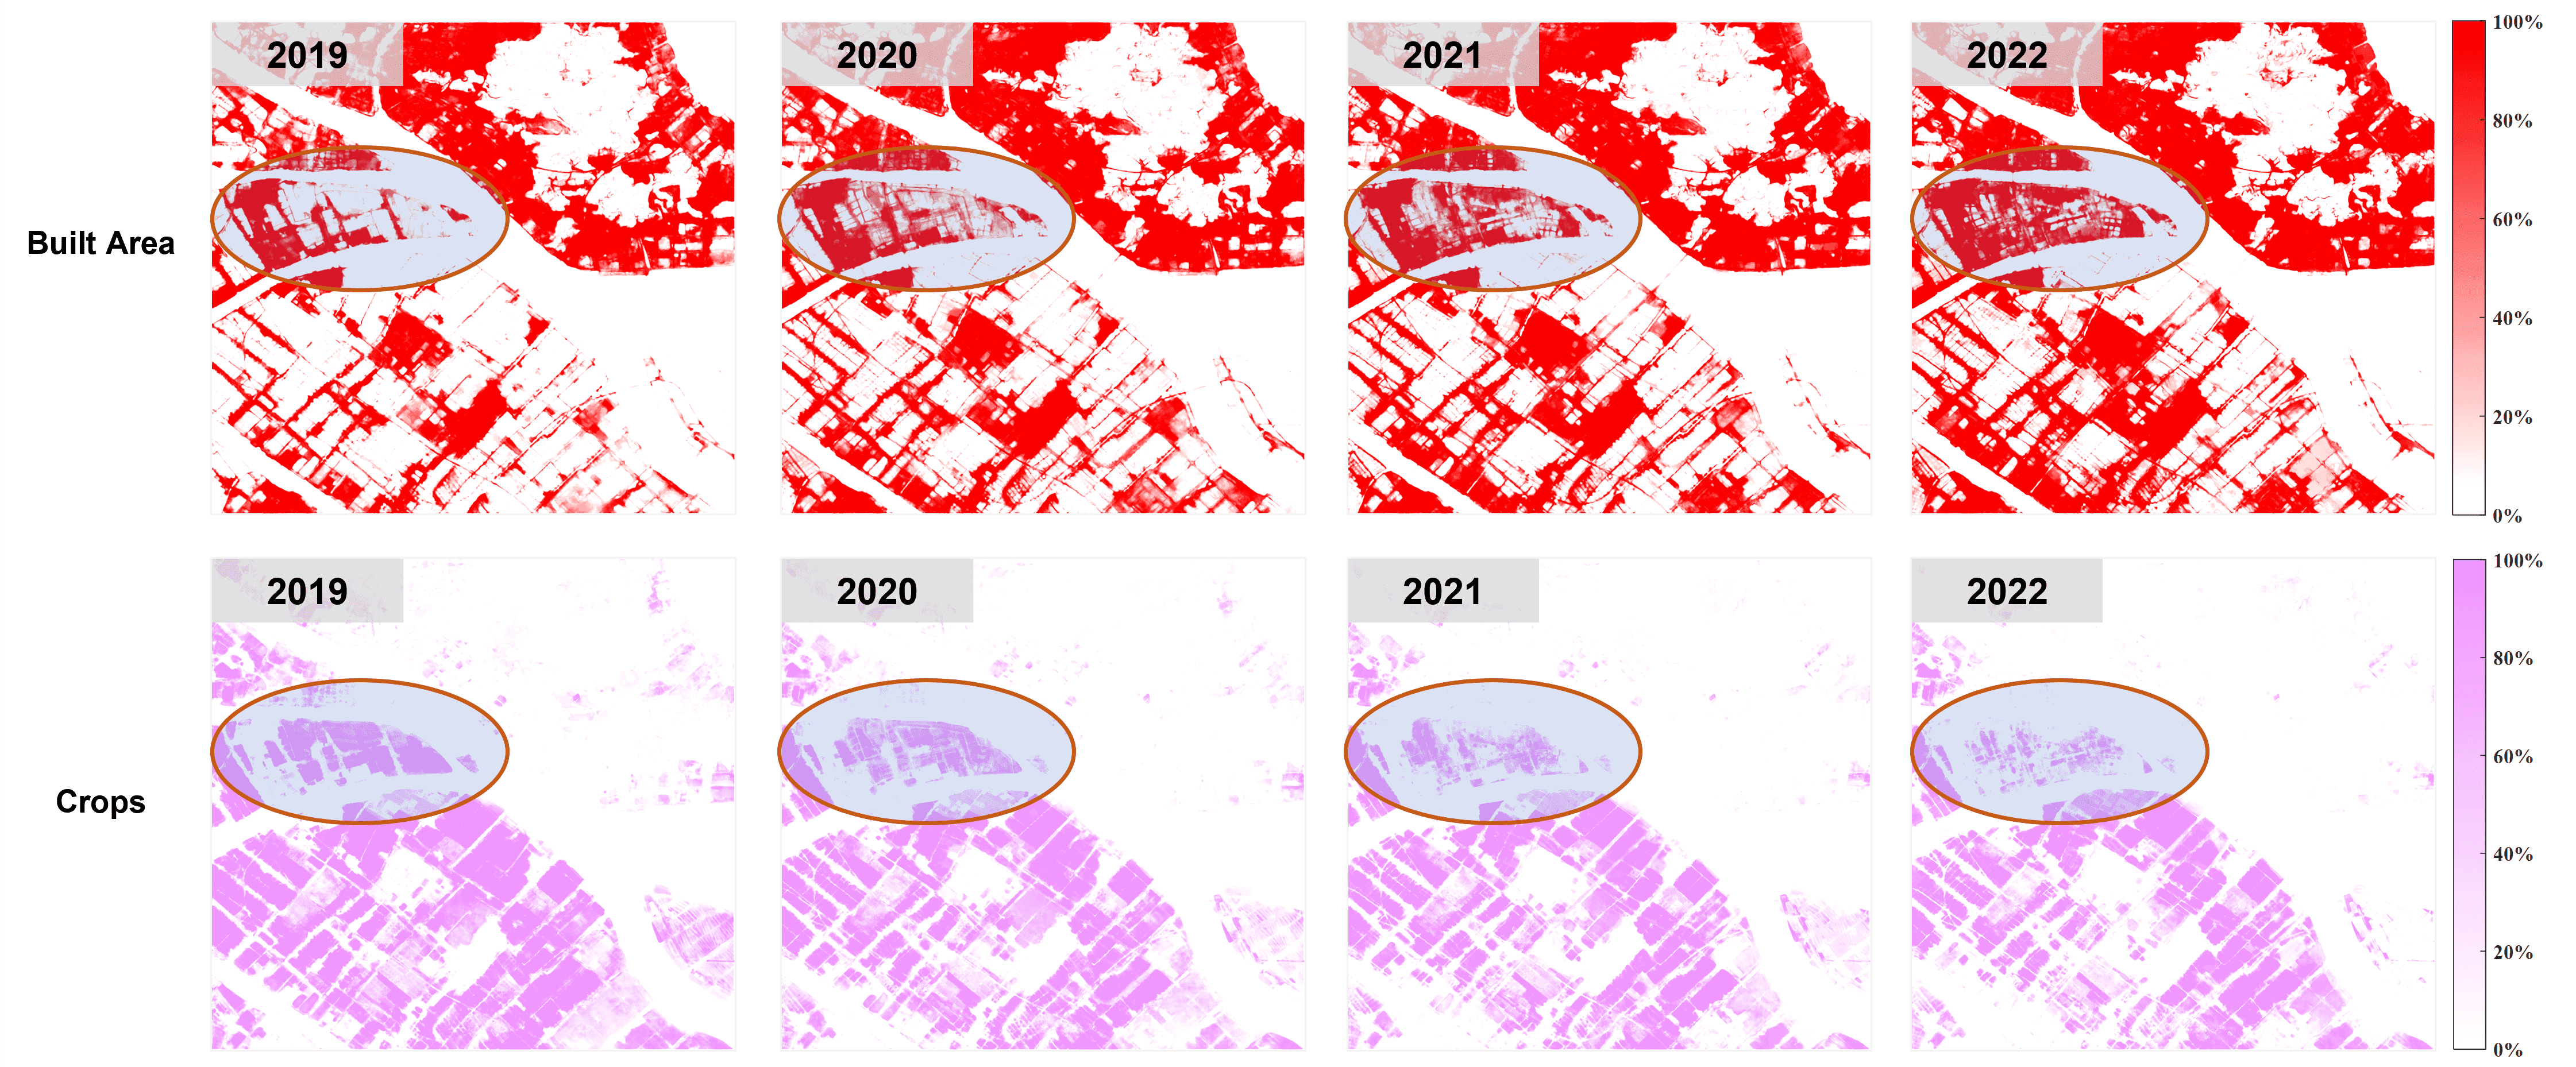
Fig. 5. Example of identifying change trends from the annual LULC frequency maps. The transition from crops to built area in this example can be clearly interpreted from their corresponding annual LULC frequency maps, which are generated based on dense time series LULC maps and represent the proportion of times a category is detected out of the total number of observations in a year.
5.3 Limitations
Although the proposed time series LULC mapping method achieved better performances than the compared methods in terms of cloud masking and LULC classification, the limitations still exist with the proposed method. On the one hand, the performance of deep models is subjective to the amount and quality of training samples used in this study, especially the Dynamic World training dataset for the training of the LULC classification model, which is rough and lacks details in object boundaries, thus limiting the model performance in identifying slim ground objects with minor sizes, such as bridges and roads, and leaving space for further improvements with high-quality training labels. Meanwhile, the performance of deep models can be further enhanced by using state-of-the-art deep architectures, such as vision transformer based foundation models, which have been proven effective in image interpretation, to exploit the potentials of the proposed method. On the other hand, cumulated processing errors can occur because multiple steps are involved in the LULC method, especially the accuracy of masks, time series reconstruction, and LULC classification. Additionally, short-term LULC changes might be hidden by clouds and cannot be effectively reconstructed and captured or might be smoothened in post-classification processing, which will result in a decrease in accuracy for near real-time and monthly LULC mapping.
6. Conclusions
An integrated method for LULC mapping using dense Sentinel-2 time series is proposed in this paper. This method can be used for near real-time, monthly, seasonal, and annual mapping in cloud-prone areas, despite the temporal variance in classification accuracy across different lengths of periods. The proposed methods have shown their superiority over the compared methods in cloud masking and LULC classification by developing deep models for improving the accuracy of cloud masking and LULC classification, employing a time series reconstruction method for filling cloud-contaminated pixels, and applying time series post-classification processing and analysis. The application of the proposed method in the GBA suggested that it can generate accurate LULC maps, achieving a mean overall of 87.01% at an annual scale and 80.13% at a near real-time scale, thereby outperforming the compared annual LULC products. We evaluated the influence of cloud coverage on LULC mapping, suggesting the necessity of developing advanced cloud masking methods to improve LULC mapping accuracy, as has been done in this study. The benefits of time series reconstruction and LULC mapping with dense time series images were also discussed, which illustrate their contributions to LULC mapping, especially in improving mapping results for LULC types involved in land and water interactions and in cloud-prone areas. The deep models in the proposed method are trained on datasets collected globally, which can be used for LULC mapping in other regions worldwide beyond the study area. Meanwhile, the proposed method can also be applied for near real-time monitoring of a single LULC category (e.g., time series monitoring of cropland, wetland, and inundated land), thus having a broad range of potential applications. Nevertheless, the limitations of the proposed method in the performance of deep models and error propagation brought by multiple processing steps leave much space for further improvements, such as integrating with the state-of-the-art large foundation model and introducing quality control during the production of LULC maps. Additionally, field surveys in the study area are required to further validate the LULC products, especially in challenging mapping scenarios, such as for grass/shrub, wetland, and flood vegetation classes. In the future, with the introduction of more advanced deep models (e.g., large foundation models) and multi-modal data (e.g., combination of Sentinel 1 and 2), the LULC mapping with dense image time series in cloud- and rain-prone areas can be further enhanced. The potentials of SAR images can be fully exploited to benefit the identification of dynamic land change patterns during periods of persistent cloud coverages.
Enjoy Reading This Article?
Here are some more articles you might like to read next: