Rooftop solar supports carbon-neutral transition in Hong Kong’s building sector
Tong, L.Y., Li, Z., Yoo, C., Jia, S., Zhu, R., & Im, J. (2026). Rooftop solar supports carbon-neutral transition in Hong Kong’s building sector. Communications Sustainability, 1, 156. [HTML] [PDF]
Highlights
- Map rooftop solar resources at 0.5 m resolution for 338,550 buildings across Hong Kong.
- Combine detailed urban morphology, high-frequency satellite cloud observations, and ground measurements.
- Estimate 3.77 TWh of annual electricity potential and 24.9 billion kg of net CO₂ reduction over a 25-year system lifetime under the study assumptions.
- Assess how installation costs, feed-in tariffs, and building electricity demand affect deployment opportunities.
Abstract
How much can rooftop solar contribute to decarbonizing a densely built, frequently cloudy city? This study develops an integrated assessment of rooftop solar energy potential in Hong Kong, connecting high-resolution solar radiation mapping with electricity generation, financial feasibility, and lifecycle carbon accounting. LiDAR-derived surface models describe rooftop geometry and shading, while Himawari-8/9 cloud observations and ground measurements support the estimation of solar radiation under actual sky conditions. The resulting assessment covers 338,550 buildings over 2016–2024. It identifies a citywide technical potential of 3.77 TWh per year after accounting for temperature-related efficiency losses. The results also show that economic returns depend strongly on installation costs and policy support. Building-level maps help identify where rooftop solar could offer the strongest energy, financial, and carbon benefits.
1. Introduction
Rooftops offer space for renewable electricity generation in cities where land is scarce. However, the amount of sunlight reaching a roof depends on its orientation, slope, surrounding buildings, terrain, and atmospheric conditions. In Hong Kong, tall buildings and complex relief create substantial shading, while clouds change both the amount and timing of incoming solar radiation.
A useful assessment must connect these physical constraints with practical deployment questions: how much electricity could a roof generate, how long would an investment take to repay, and how much carbon could be saved after accounting for the manufacture and disposal of the system? We address these questions within one building-level framework.
2. Data and methodology
The assessment combines 0.5 m LiDAR-derived digital surface models, building footprints, Himawari-8/9 cloud optical thickness, and ground observations of solar radiation and temperature. The analysis represents the 2016–2024 period.
The workflow has three main components:
- All-sky solar radiation estimation. A hemispherical viewshed model describes clear-sky radiation and shading. A random forest model combines clear-sky radiation with satellite cloud optical thickness to estimate all-sky daily global solar radiation (GSR). Ground observations at King’s Park support model training, and an independent station at Kau Sai Chau is used for validation. SHAP analysis supports interpretation of the model inputs.
- Rooftop electricity potential. Radiation maps are combined with deployable roof area, photovoltaic efficiency, performance ratio, and temperature effects to estimate solar energy potential (SEP) for individual buildings. The study assumes that 50% of each building footprint is available for deployment and uses a performance ratio of 0.83.
- Economic and carbon assessment. Installation-cost and feed-in-tariff scenarios are evaluated alongside lifecycle carbon emissions and potential contributions to building electricity demand.
The 0.5 m resolution describes the rooftop radiation mapping grid. The cloud optical thickness product has a native resolution of 5 km. Resampling it to the rooftop grid aligns the inputs but does not add spatial detail to the cloud observations.
3. Results and analysis
3.1 Clouds and urban form shape rooftop solar resources
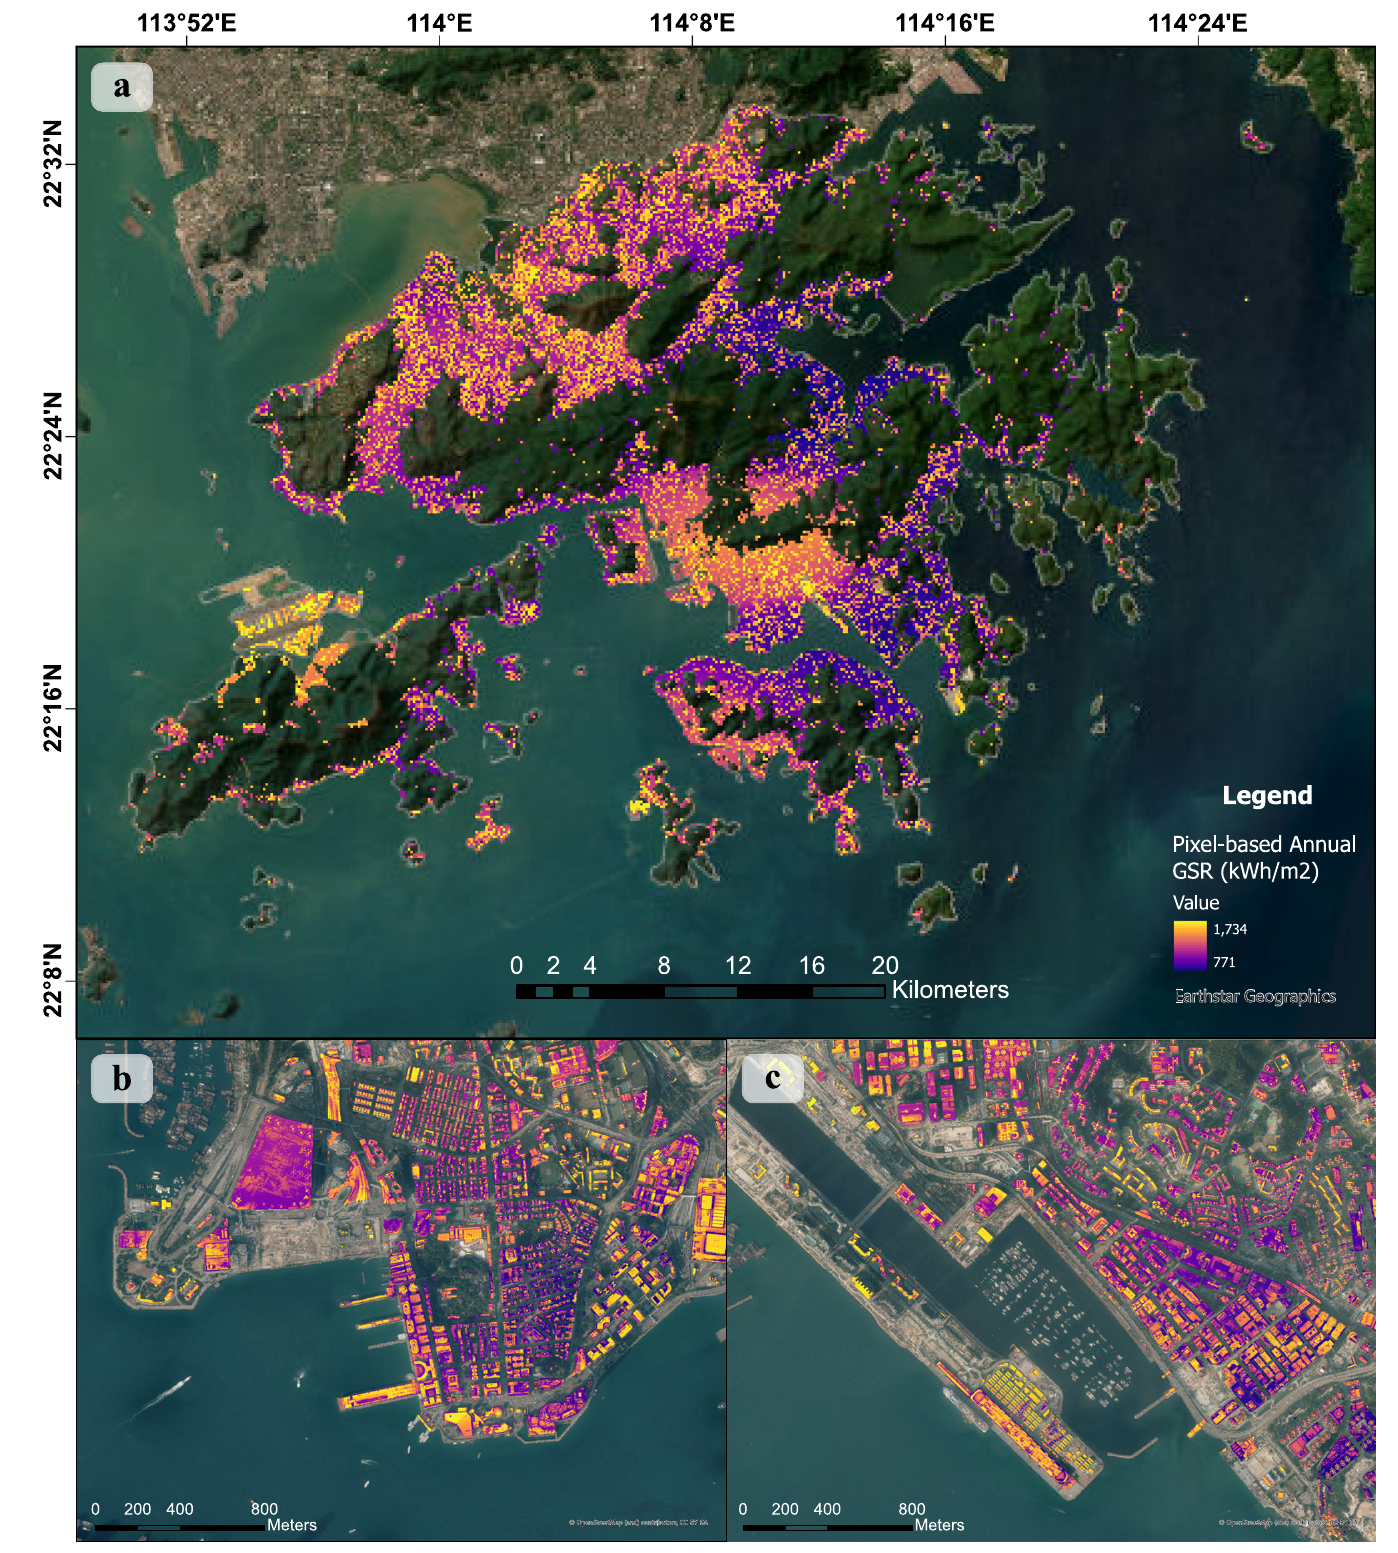
All-sky GSR is approximately 50% lower than clear-sky GSR on average. Cloud attenuation is strongest in summer, showing why clear-sky assumptions can substantially overestimate solar resources in cloudy cities.
The maps also reveal strong variations within the city. Shaded slopes and dense groups of tall buildings receive less radiation, while large, relatively unobstructed roofs offer more favorable locations. A citywide average therefore provides only part of the information needed for selecting deployment sites.
3.2 Citywide and building-level electricity potential
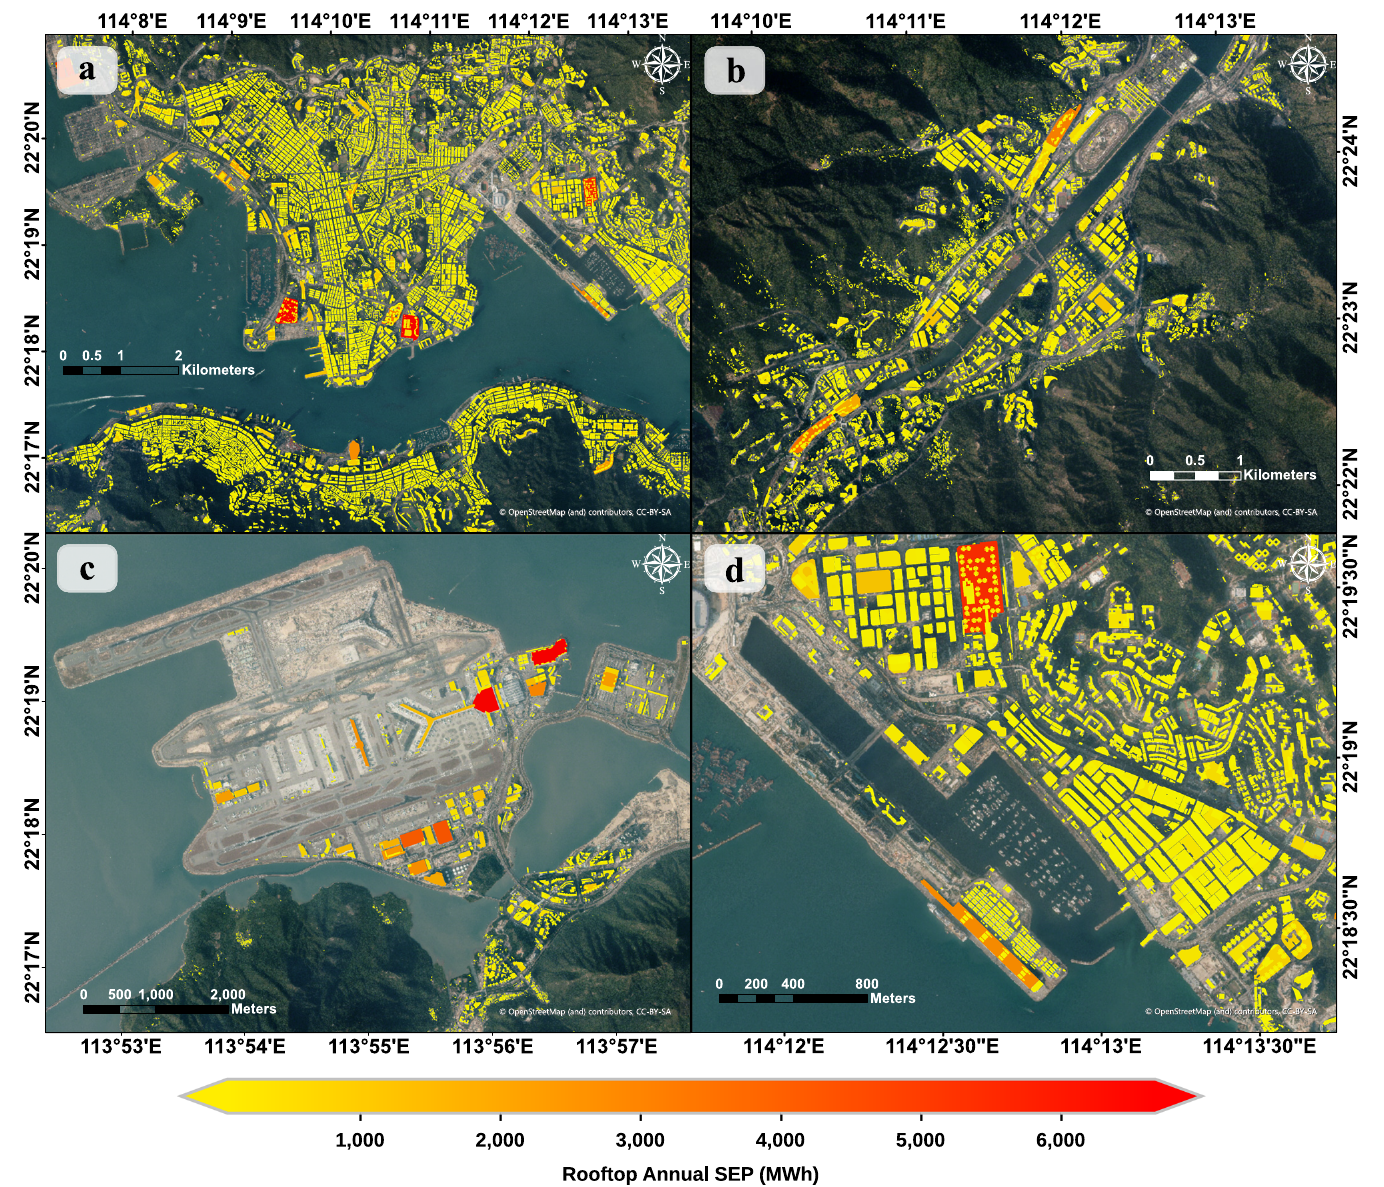
After incorporating temperature-dependent photovoltaic efficiency, the estimated annual technical potential decreases from 3.85 to 3.77 TWh. This corresponds to approximately 8.28% of Hong Kong’s electricity consumption under the demand baseline used in the study. The estimate assumes full use of the deployable area defined above.
Large roofs, including those around Hong Kong International Airport, stand out in the building-level assessment. Yuen Long contributes the largest district total, accounting for approximately 19.1% of citywide annual SEP. These spatial differences support targeted planning rather than uniform deployment assumptions.
3.3 Economic returns depend on costs and policy
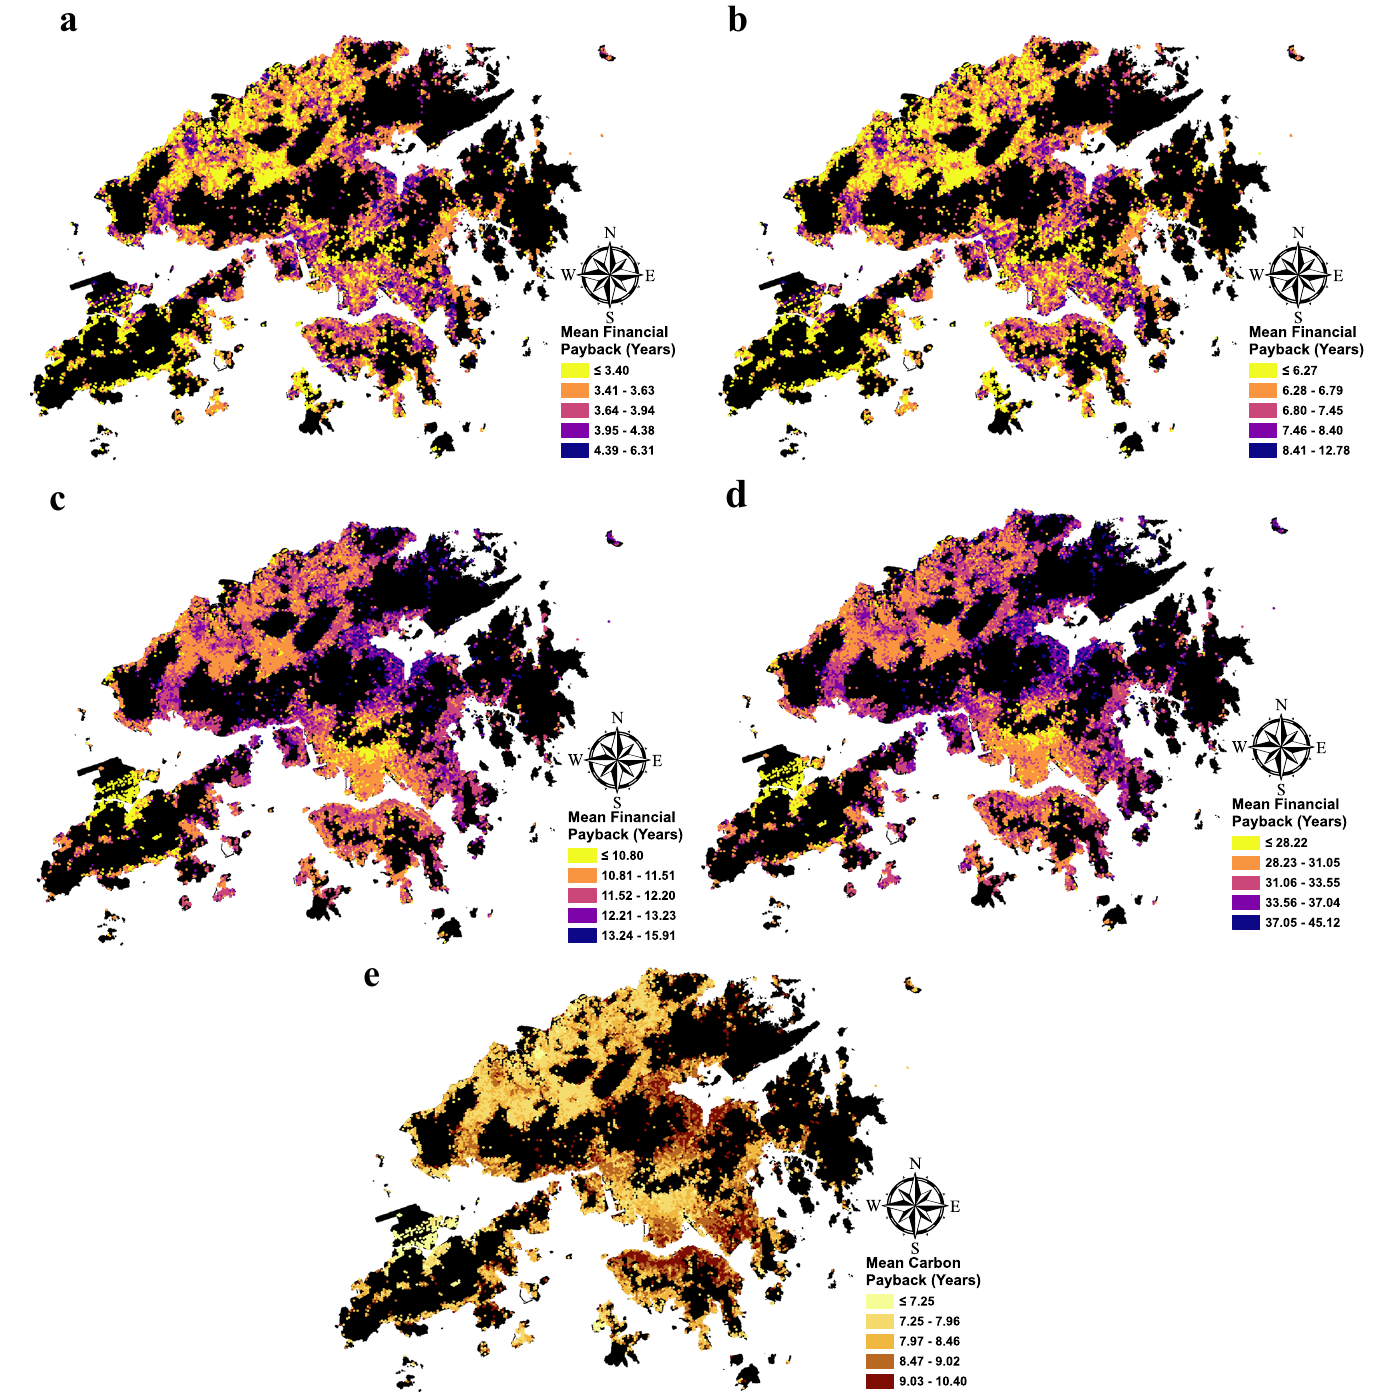
The paper compares two installation-cost scenarios, with and without feed-in tariffs (FiT). Mean financial payback periods are summarized below.
| Initial system cost | With FiT | Without FiT |
|---|---|---|
| HK$30,000/kW | 3.49 years | 11.58 years |
| HK$50,000/kW | 6.42 years | 31.49 years |
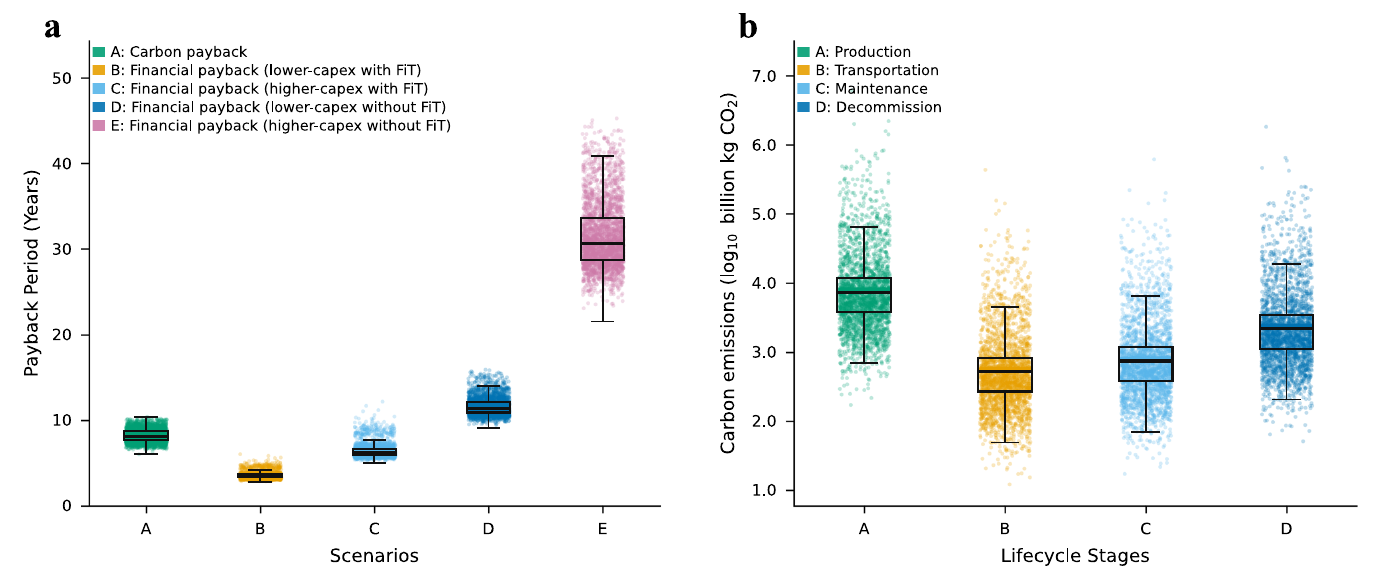
Financial payback is the time needed for cumulative discounted net revenue to recover the initial investment. These are scenario-based estimates; without FiT, revenue is valued at the grid retail price assumed in the paper. Under the higher-cost scenario without FiT, mean payback exceeds the assumed 25-year system lifetime. Payback under the FiT scenario also needs to be considered alongside the scheme’s remaining duration. The table alone does not imply that every building can recover its investment before the current scheme ends.
3.4 Lifecycle carbon benefits and commercial buildings
Lifecycle accounting includes emissions from production, transportation, maintenance, and decommissioning. The estimated net carbon reduction is 24.9 billion kg CO₂ over the assumed 25-year system lifetime. The mean carbon payback period is 8.18 years: the time required for cumulative emissions avoided by displacing grid electricity to offset the system’s lifecycle emissions. Financial payback measures investment recovery, while carbon payback measures the carbon balance.
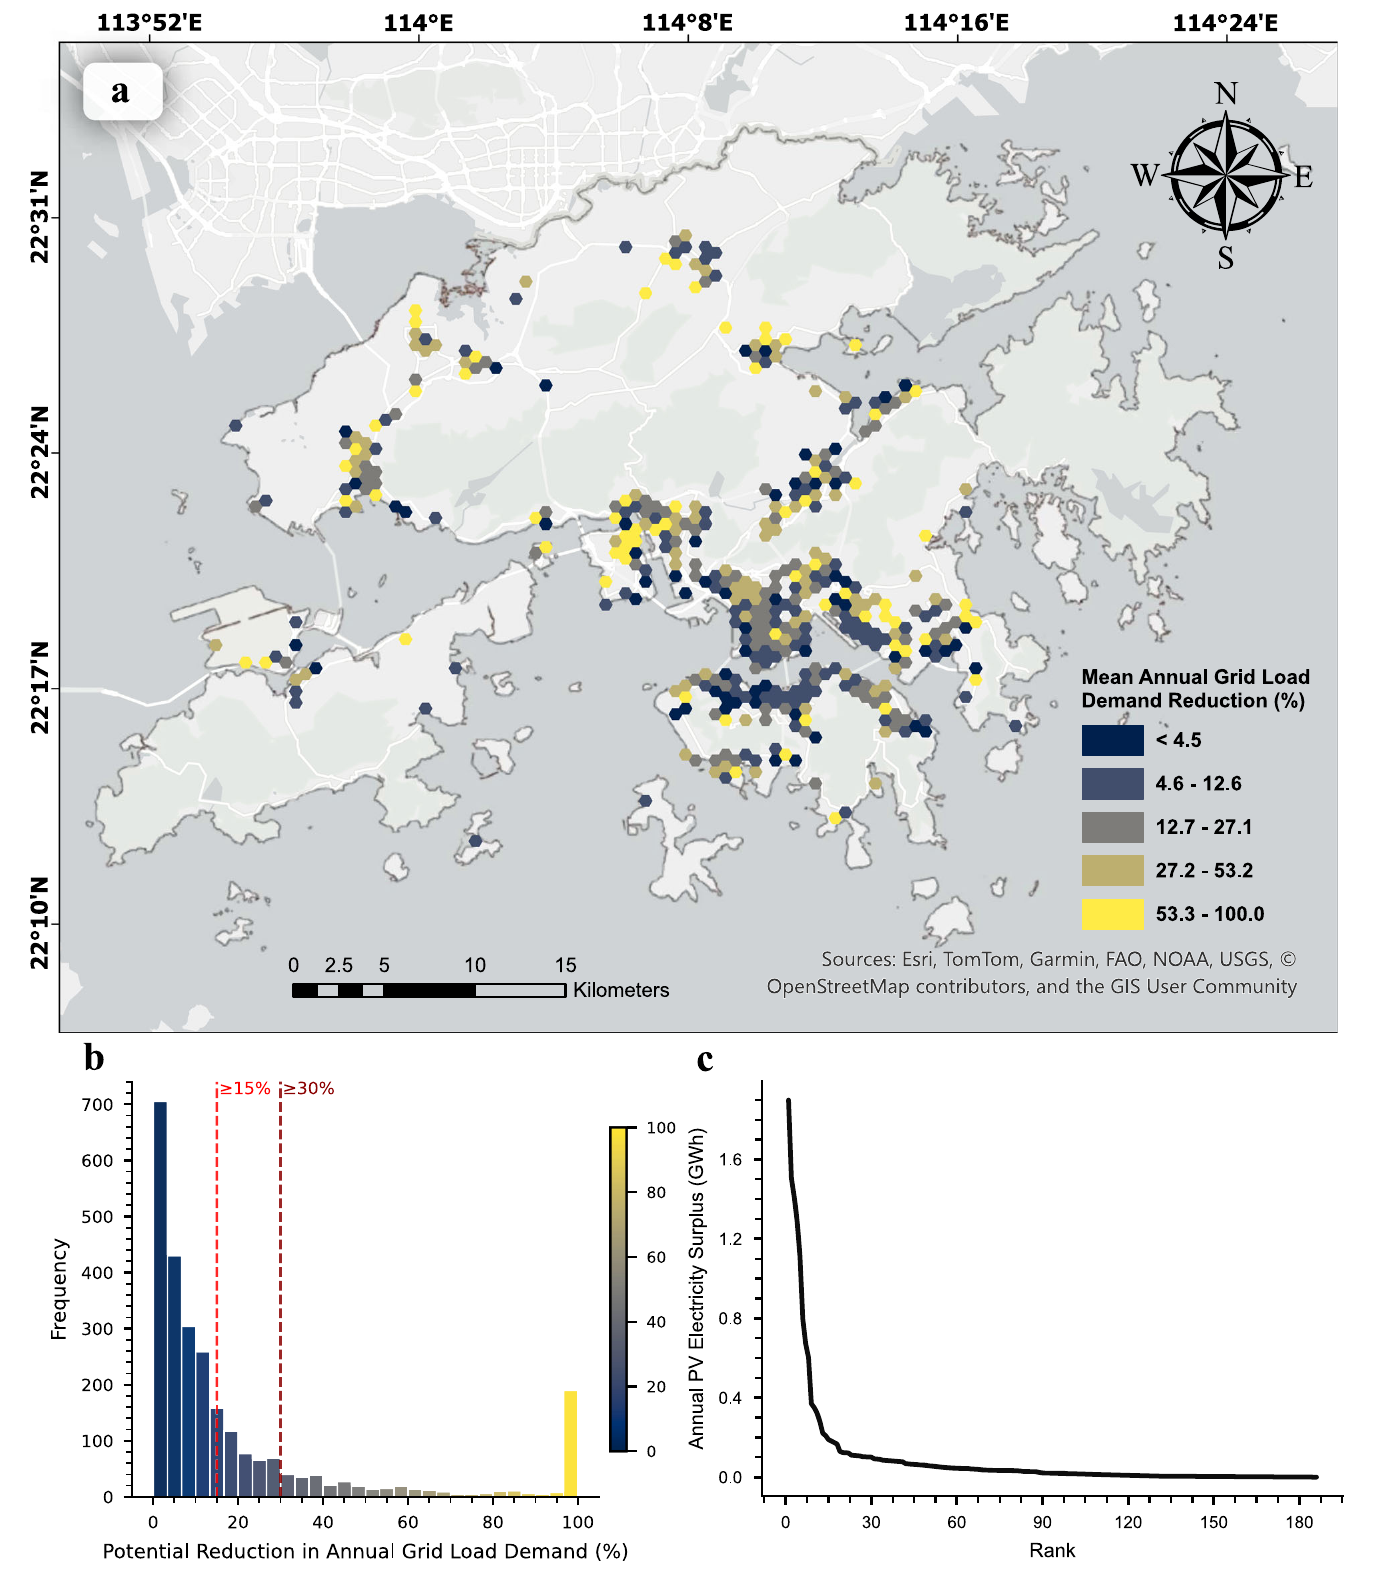
For the sample of 2,695 commercial buildings with electricity-use data, 18.9% could potentially reduce annual electricity drawn from the grid by at least 30%, assuming full use of the deployable roof area, energy storage, and ideal matching between generation and demand. This proportion applies to the analyzed sample and helps identify commercial buildings where rooftop PV could make a substantial contribution.
4. Discussion and limitations
The framework connects rooftop-scale mapping with decisions about where to deploy solar, how policy affects investment, and how supply-chain emissions affect net carbon benefits. It also shows why cloud dynamics should be included explicitly when assessing solar resources in subtropical cities.
The estimates depend on assumptions about usable roof area, system performance, costs, and future operation. The financial and carbon assessments assume full use of the deployable area, energy storage, and perfect matching between generation and demand. Actual deployment requires further analysis of hourly mismatches and storage requirements. Radiation-model training and validation rely on a limited number of ground stations; aerosol effects are not explicitly modeled, and the coarse cloud product cannot resolve small cloud fragments.
Structural capacity, rooftop equipment and other obstacles, fire-safety setbacks, and building-specific installation constraints also require assessment. Transferring the framework to another city requires local meteorological observations, building data, electricity-demand information, economic parameters, and emission factors.
5. Conclusions
Rooftop solar offers a substantial contribution to Hong Kong’s low-carbon transition under the modeled deployment scenarios. Detailed building information and cloud observations make the assessment more realistic, while economic and lifecycle analyses show where technical potential can translate into practical benefits. The resulting maps provide a basis for prioritizing buildings and districts for further investigation.
Code and resources
Please note: the content above was compiled and translated by AI based on the original paper.
Enjoy Reading This Article?
Here are some more articles you might like to read next: